Understanding Your Body Composition Scale Measurements
The Marsden body composition scales range offer a number of measurements to provide a complete picture of body health, in even greater detail.
To ensure you get the most out of your body composition scale, this blog post will help you understand the measurements the scales provide - and if you need any more help, please leave a comment or get in touch with our team.
What is a body composition scale?
A body composition scale is a type of weighing scale that provides the user with a calculation of their body health. Body composition measurements include body fat, muscle mass, protein mass and metabolic rate. Over time the user can see, in detail, the results of their weight loss or fitness programme.
As well as gyms, sports clubs and slimming clubs, hospitals also use body composition scales as they help provide a true assessment of patient health.
Marsden body composition scales use biometric impedance analysis (BIA) to calculate the readings. This means a safe and very small electrical current flows through the body from the base of the scale. It works because electrical current flows through matter , such as water, fat and muscle, at different speeds - allowing the scale to calculate the volume of each element within the body based on the speed of the electrical current.
In times of rising obesity, a knowledge of body composition can help patients or gym members to stay in shape.
How accurate are body composition scales?
Marsden body composition scales are Class III Approved which means that legally they can be used in hospitals for monitoring, diagnosis and treatment.
The NHS use DEXA scanners - a special type of X-ray specially designed to identify low bone mineral density. Because these machines carry out a full body scan, they are about as accurate as you can get for precisely measuring the composition of a body. Thus, DEXA scanners are seen as the ‘gold standard’ for body composition and the standard that Marsden judges body composition scales by.
A BBC One Show test noted inaccuracies in bathroom scales of up to 30% - yet the Marsden MBF scales are within 3% of DEXA. The closest competitor tested by Marsden during the development of the MBF-6000 and MBF-6010 was within 7% of DEXA.
What do body composition scale readings mean?
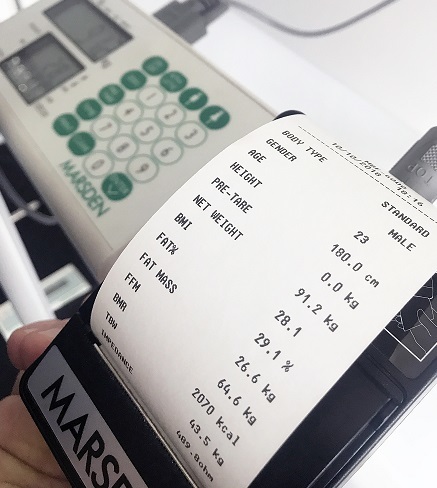
The most common readings on body composition scales are BMI, Body Fat Percentage, Total Body Water, Basal Metabolic Rate, Fat Mass and Fat Free Mass. At Marsden, our body composition range offers a total of 40 readings which we will cover in-depth in this guide.
Total Body Weight
You don't need a body composition scale for this measurement. But, many users do still like to know how much they weigh and expect to see it on their results sheet. Plus, weighing results from high-quality body composition scales is likely to be more accurate than a bathroom scale.
It's important to note, however, that while body weight is a good indicator of health, it shouldn't be assumed that a 'heavyweight' measurement means unhealthy. Muscle is heavier than fat, therefore you may weigh more once you've increased your skeletal mass. This is nothing to worry about.
Body Mass Index (BMI)
BMI is the most common way of determining overall body health and whether a person is underweight or overweight.
To calculate BMI simply divide a person’s weight in kilograms by square metres in height. BMI can be calculated on many weighing scales. It is a non-invasive way of assessing body weight - with links drawn between BMI and illness. BMI scales are a popular choice for many users to better understand their body health; however, BMI does not provide an indication of the distribution of body fat.
However, muscular users are often defined as 'obese' according to BMI. This is because BMI only uses weight and height and cannot distinguish between muscle and fat. This is why we recommend using the PBF figures instead.
Percentage Body Fat (PBF)
Body Fat Percentage gives a good indication of body health, but interpreted by itself could give a slightly misleading picture.
Body fat percentage is the proportion of fat mass compared to everything else (bones, muscles and water) and is displayed as a percentage.
The Royal College of Nursing says the healthy target for body fat percentage changes with age. For men aged 20-39, for example, the target body fat percentage is 8-20%; after 60 years of age this increases to up to 25%.
Total Body Water (TBW)
The Total Body Water measurement shows how hydrated the body is. Water is used in the body for transporting waste, helping organs to function, regulating body temperature and digestion.
The amount of fluid consumption required varies from person to person, and is influenced by climate and the amount of physical activity undertaken. Experts recommend an individual’s consumption should be at least two litres of fluid per day.
An average Total Body Water reading for men is 55-60%; for women it is 50-55%.
Intracellular Water (ICW)
Water that is located inside your cells is called Intracellular Water. This plays an important role in allowing molecules to be transported to different organelles inside the cell.
In a healthy person, intracellular water should make up two-thirds of the Total Body Water. The other third should be made up of Extracellular Water (ECW).
Having an increased ICW can signal a positive change in your body composition. When muscle cells become larger, they require more ICW in order to power their cellular functions. Increased ICW contributing to an increased lean body mass can lead to an improved BMR, increased strength and a better immune system.
Extracellular Water (ECW)
Water found outside of cells is called Extracellular Water - which helps tissue to function well. Nutrients are served to membrane-bound cells via extracellular water, such as sodium, potassium, calcium, chlorides and bicarbonates.
An increase in extracellular water can cause excess weight and swelling in your limbs. Imbalances may cause symptoms such as decreased mental alertness, nausea and dizziness or result in high blood pressure.
Typically, roughly one-third of your body is extracellular water.
Edema Index
The ICW and ECW results can then be used to calculate the Edema Index (EI). Kidney disease or inflammation, for example, could result in a high EI, so this is useful to identify risk.
The Edema Index calculation is ECW/TBW. The Edema Index result should ideally lie between 0.36 and 0.39.
Basal Metabolic Rate (BMR)
Basal Metabolic Rate is the number of calories burned by the body when you’re doing absolutely nothing. It is based on the number of calories the body would need if resting for 24 hours. These calories are used for the body’s vital functions, such as breathing, blood circulation, brain function, cell growth and the regulation of body temperature.
This allows you to calculate an accurate calorie intake target for your body far more accurately than a generic calculation that might be found online, enabling you to create a diet programme.
A person with a high BMR burns more calories than a person with a low rate. Around 70% of calories consumed every day are used for your basal metabolism. It fits hand in hand with muscle mass, as the greater the muscle mass, the higher the BMR and the more calories are burned.
The average woman can expect to have a BMR between 1,200-1,600 calories a day, whereas a man can expect a BMR between 1,600-2,000 calories a day.
Total Energy Expenditure (TEE)
The Total Energy Expenditure is calculated for a normal day without significant activity. However, this is not exact and should not be viewed as such; actual energy expenditure will vary depending on a person’s Physical Activity Level (PAL) and their BMR.
Body Fat Mass (BFM)
Fat Mass is the total mass of fat in the body and is useful for identifying the effectiveness of a training programme.
Some body fat is classified as ‘essential fat’ - which the body needs to function and keep organs warm. Therefore a very low Fat Mass reading can be dangerous.
Calories or energy in the body come from what we eat and drink. Energy is burned from physical activity, but if you consume more than you burn excess calories are stored in fat cells, culminating in excess body fat. Too much body fat can damage long-term health.
Fat Free Mass (FFM)
Where Body Fat Mass is the total mass of the fat in the body, Fat Free Mass is everything else: including bones, muscle and water.
A Fat-Free Mass of around 10-12% for men and 20-32% for women is ideal.
You can read more about these readings in this white paper.
Visceral Fat Area level (VFA)
Visceral Fat is often given a bad rap, after all the skinny fat phenomenon is well documented. While it does have some negatives, a healthy amount of visceral fat is useful as it insulates and protects your vital organs. Ensuring you have a healthy level of visceral fat directly reduces the risk of diseases such as heart disease and high blood pressure.
VFA is used to determine the risk of diabetes, alongside BMI. VFA is shown as a level out of 50, with a score of 41-50 indicating an extremely high risk.
Muscle Mass (MM)
This consists of skeletal muscles, smooth muscles and the water which is contained within them.
As muscle mass increases, the rate at which energy is burned increases, accelerating the basal metabolic rate. An increase in muscle mass may increase total body weight as muscle weighs more than fat. Therefore, it is important to monitor each aspect of the body separately using measurements from body composition scales.
Skeletal Muscle Mass (SMM)
Skeletal Muscle is one of three major muscle types (alongside cardiac and smooth muscle). It is the most common of the three. These types of muscles are attached to bones by tendons and produce all the movements of body parts in relation to each other.
SMM correlates with athletic performance, as it is a good indicator for muscle gains and progress. When SMM is insufficient, joints bear a significant burden due to body weight, increasing the chance of injury.
It’s also worth noting that the higher the SMM, the better it is for the body. So, the 'Over' result on your results sheet should be referred to as 'overachieving' for SMM, rather than 'over the recommended amount'. In fact, we recommended training to reach the 'Over' SMM level.
Soft Lean Mass (SLM)
Soft Lean Mass excludes the minerals that are found in the bones.
The more lean body mass you have, the higher your metabolism is likely to be. Having a healthy percentage of lean body mass may make you less likely to become sick or to develop health problems such as heart disease or diabetes. Having a low lean body mass, however, may increase the risk of side effects from medications.
This should generally be between 60% to 90% of body weight.
Bone Mineral Content (BM)
This tracks the amount of bone minerals found in the body. A higher bone density and strength is indicated by a higher bone mineral content.
Calcium is the largest contributor to bone mineral content.
Protein Mass
Protein Mass tracks the amount of protein in the body. A lack of protein can be linked to an increase in body fat. There is a link between protein mass and muscle mass. As you get older you need more protein due to anabolic resistance, which lowers the body’s ability to break down and synthesize protein
What percentage of your body should be protein?
Ideally, protein should make up about 12% to 20% of your total daily calories. Protein is essential for keeping your body healthy and working the way that it should. Your body needs protein to maintain your body, for growing and for energy.
Metabolic Age (AGEM)
This is worked out by comparing the Basal Metabolic Rate to the average BMR of your age group. If the metabolic age is higher than your actual age, it is a sign that you need to improve your metabolic rate.
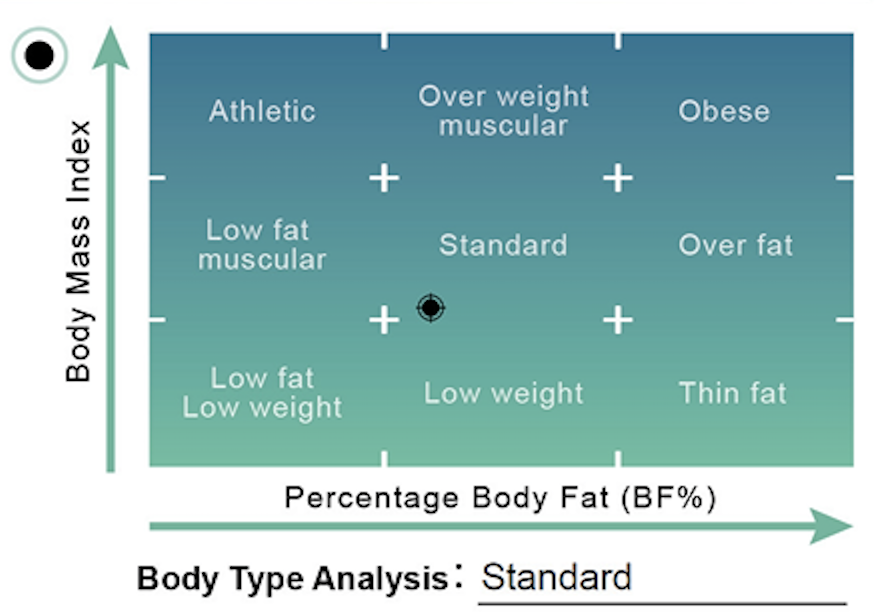
Body Type Analysis (BTA)
The Body Type Analysis table compares a user’s BMI to their Body Fat Percentage to determine the source of their weight, which is then plotted on this graph to categorise the user’s body type.
The benefit of doing this is that the user can then see if they have hidden obesity. Thin fat, for example, is a person who has a relatively low body weight, which is made up predominantly of fat. So while they may appear thin on the outside, they are not actually healthy.
Body Balance Evaluation
The Body Balance Evaluation covers how well-balanced your body is. Imbalances in different body segments can increase the risk of injury or posture-related health issues.
This section consists of a number of tick boxes. As is to be expected, a user should ideally have ticks across the top of the columns to show that they have a well-balanced body. However, if a section of the body is less developed than the other body, it can create an imbalance.
Muscle Quality
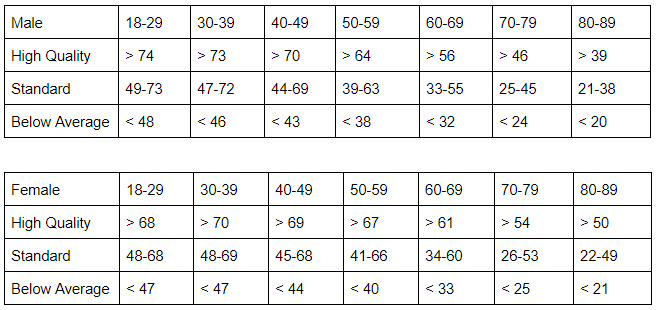
Muscle Quality combines variables such as gender and phase angle (more on that later) to estimate grip strength. Grip strength is a general indicator of muscle quality, and is useful in tracking, evaluating and improving physical fitness programs.
However, two people who have muscles of the same size, may not have the same muscle quality. One person may be stronger than the other, despite their muscles being the same size. This is because your muscles consist of two types of tissue.
Contractile tissue contracts and produces force, whereas connective tissue keeps the muscle together. Fat is also present in a muscle. The more contractile tissue a muscle consists of, the stronger it is and the higher the muscle quality is.
A good muscle quality score depends on your age and gender; we’ve summarised these ideal scores in the table below.
Health score
The health score provides an overall score for your body, taking into account height, age, weight and gender information. It is calculated out of 100; the higher the score the better.
A normal health score should be between 70-80, anything lower than a 60 is considered a health risk. A health score between 80-90, implies that the user participates in regular physical activity. Usually, only a professional athlete will achieve a health score of 90+.
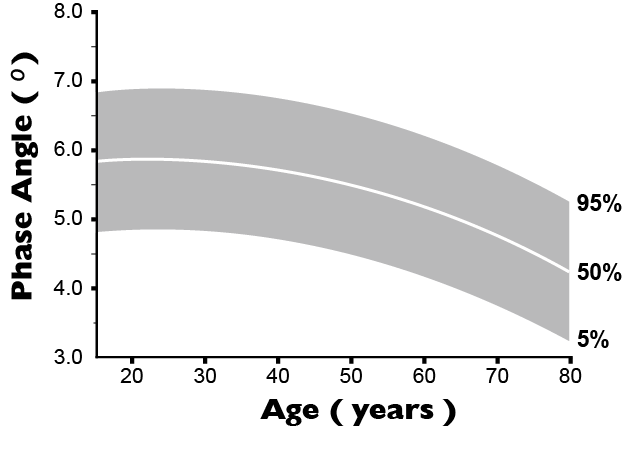
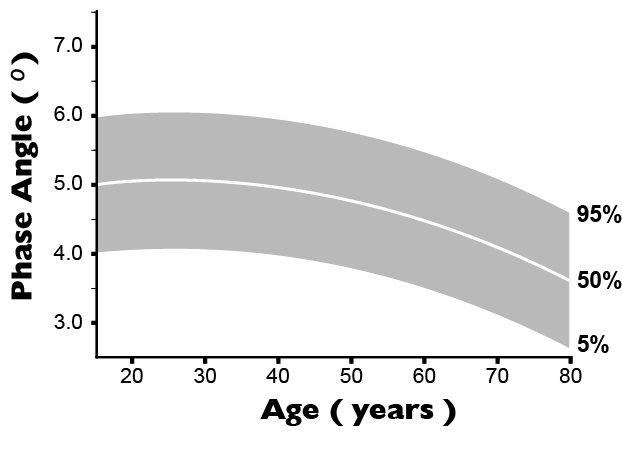
Phase Angle
The phase angle is an indicator of overall health, metabolic activity and nutritional status. Basically, people with healthier muscles/body cells have a younger body age, which results in a higher phase angle.
The higher the phase angle is, the healthier your body is. Typically a man will have a higher phase angle than a woman, and a phase angle tends to decrease with age. However, if your client is training hard then their phase angle should gradually increase. If it steadily decreases, then that may be a sign that something is wrong with the body.
It’s important to remember that a phase angle will change from person to person, so you should compare your phase angle with your previous readings, rather than someone else’s. Generally, the phase angle range should be between 1 to 20 degrees. Typically it will be between 4.5-6.7 for males and 4.0-6.0 for females, but this will decrease as you age.
Below are two charts to help with your understanding of phase angles. There is one for males and one for females, so make sure you're looking at the correct chart.
Fat-free Mass Index (FFMI)
The Fat-Free Mass Index is used to evaluate the risk of a user being malnutritioned. For men, we recommend that this figure is higher than 16.6 kg/m2 and for women we recommend that this is higher than 12.9 kg/m2. These are the cut-off points.
Skeletal Muscle Index (SMI)
The Skeletal Muscle Index is the ratio of muscles in a user’s arms and legs in comparison to their height. It is used to evaluate the risk of Sarcopenia - the generalised loss of skeletal muscle mass and strength with age. In older people this has substantial tolls in terms of morbidity and disability.
Men should aim to have a score higher than 7.5kg/m2 to be within a healthy range. For women, the score should be higher than 5.67 kg/m2.
Control Guide
The Control Guide recommends the next steps a user should take by providing clear number goals.
The Control Guide’s recommendations are defined by the needs of the athletic population (or those striving to become more fit), and not the 'average person'. As such, there may be some differences between the Control Guide (fitness-focused, higher standards) and the Muscle-Fat Analysis, which uses normal ranges based upon BMI and body fat percentages relevant to the average population.
Impedance
The MA601 measures the impedance, reactance and resistance of the five sections used on the Segmental Lean and Fat Analysis. These are right arm (RA), left arm (LA), trunk (TR), right leg (RL) and left leg (LL). 3 different frequencies are used as they have different properties when travelling through the tissue.
This result is generally a useful troubleshooting tool for body composition scales. Body composition results are calculated using a combination of weight, age, height, gender, and impedance. If an input is incorrect, then results will naturally be flawed.
If the measurements given by your body composition scale appear 'odd' then you can check to see if impedance is also strange. Strange may be something like left and right hand impedance differing by more than 50 ohms.
Marsden body composition scales
Marsden has a range of body composition scales, some of which are Class III approved and therefore suitable for use in hospitals.
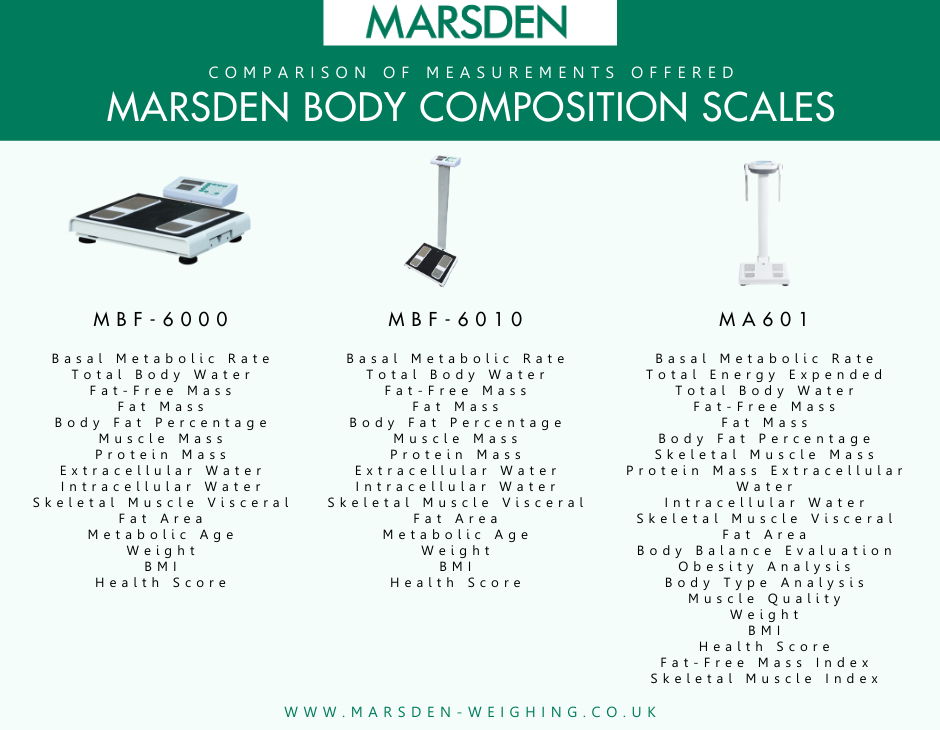
MBF-6000: This scale provides a comprehensive body health assessment on a portable scale. It has a 300kg capacity and graduations to 100g. They are widely used in hospitals and gyms but are also are suitable for use by mobile physicians, physiotherapists, nurses and personal trainers. They are portable and cover a number of features listed above, and are supplied with a printer.
MBF-6010: This body composition scale is widely used in hospitals, gyms and sports clubs. It differentiates from the MBF-6000 because it is fitted with a column and makes for a more permanent solution.
Charder MA601: This body composition analyser is the most sophisticated body composition scale we offer. It includes the majority of the measurements above and utilises 3 frequencies to provide precise results.
The table below breaks down the readings offered by our body composition scales for an in-depth comparison:
Explore our range of Marsden Weighing body composition scales today. If you have any questions about body composition measurements, email our team at sales@marsdengroup.co.uk.
Outside of the UK? You can order Marsden scales through one of our international dealers - or direct from us, over the phone. Speak to our team on +44 (0) 1709 364296 to find out more.
Further Reading
Protein mass is considered an important measurement on body composition scales, but why is that?
Bodyweight is often associated with physical health, but what about mental health? Find out about the connection between weight and mental health here.
BMI is a popular measurement to use for tracking weight-loss and health. But is body fat a better measurement to track?